
3D PRINTED/ADDITIVE
For the 3d Printed & Additive parts, there are 3 primary areas that have had a large amount of success when adopting CT Scanning. These areas include:
Validation of Must Run Parts
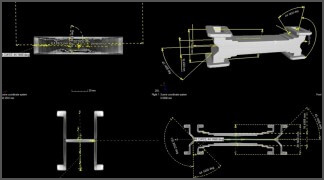
Typically in high performance Additive applications, printed components cannot fail when in use. Parts and assemblies that fail to function properly could compromise the application they are being used for resulting in an equipment or catastrophic failure. CT scanning can provide another level of reassurance on top of traditional inspection techniques to further reduce the risk of a compromised product escape. Visualizing the internal cross-sectional slices of a CAT scanned part or identifying physical geometry variations has been proven to aid manufacturing companies and their suppliers to ensure a quality product is being used. Going a step further surface profile validation, wall thickness variations, and first article inspection (FAI) can also be completed in a free state environment while preserving the integrity of the original component to allow it to undergo further testing or be approved for use in a production environment. Depending on the overall cost or key function of the product, sometimes CT inspection of every sample can be cost justified in very specific scenarios. For very delicate or high functioning parts residual powders, pores, inclusions, and cracks can also be detected with CT scanning. Over the years CT scanning has proven to be highly beneficial for validating lightweight components, heat exchangers, high performance products, and components that could not be manufactured with subtractive manufacturing means. Although polymer-based materials can be easily inspected with CT scanning, typically the value and the importance of the product is not high enough to warrant such a costly inspection. Therefore most additive parts that are inspected with computed tomography are alloy based and manufactured out of aluminum, titanium, stainless steel, Inconel, copper, or nickel.
Printer Performance Validation
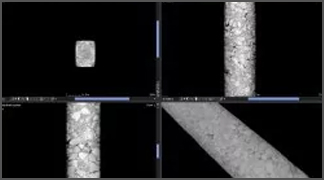
For Additive parts, X-Ray and CT scanning of test bars and cylinders has proven to be highly beneficial for verifying the performance of a high precision metal additive printer. When the optimum printing parameter needs to be verified for a specific material, just selecting a general operating parameter and material isn’t enough in some cases. Sometimes the print settings need to be 100% verified for print quality and by print location. Manufacturing a series of cylinders printed at different locations with different print parameters has proven to be highly beneficial when paired with CT scanning. Not only can CT scanning identify the sample with the lowest number of defects in each area, but it can also verify the print quality through the print bed. Once optimum print settings have been validated, test bars can be printed, scanned, and ran through performance testing to further verify the print quality, compression, and tensile strength.
Benefiting from Service Labs
As the technology is rapidly being adopted and standards are evolving all the time, utilizing a certified CT service lab ensures proper compliance to the latest standards and requirements. This ensures the project is completed according to a verifiable process and the experienced lab can not only complete the results but communicate the results. As computed tomography data is complex, large in file size, and new for some people; effective communication is key to ensure all parties are properly informed of the results for effective decisions to be made.
ARTIFACT
For Artifacts, there are 3 primary areas that have had a large amount of success when adopting CT Scanning. These areas include:
Gaining Insight into the Sample
X-Ray and CT scanning technology has yielded valuable insight for research of artifacts by obtaining detailed images of internal features that were once inaccessible. Objects can be virtually sliced in 3D with CT Scanning providing critical data of features like material distribution, object construction, and original functionality. Actual/nominal comparisons are also available with computed tomography. For example, surface data from one specimen can be superimposed upon another to identify subtle differences in morphology which can be measured with a high dimensional accuracy. The versatility of CT inspection lends itself to a wide range of artifacts and other miniature samples as the samples become smaller and Micro-CT scanning allows for improved scan resolution and insight. CT can even virtually remove surrounding material like soil or gypsum from buried archaeological artifacts like coins, metal objects, tools, textiles, clay vessels, and ancient remains.
Data Archiving
CT scanning is a useful Non-Destructive Testing (NDT) technique for conservation and natural history, providing high resolution data files for a wide range of materials from metals and ceramics to glass and organic material. For example, computed tomography can aid in the data acquisition of museum artifacts through reverse engineering of internal and external geometries to 3D print detailed replicas. In this way, museums can showcase replicas of fragile or unique artifacts and improve interactivity within their exhibitions. As CT scan data is digital it allows for perseveration of the original sample, data archiving for long term storage purposes, and data sharing for allowing multiple people to interact an unlimited number of times with the scan data.
Benefiting from Service Labs
As the technology is rapidly being adopted and evolving all the time, utilizing a qualified service lab ensures proper controls during the outsourcing process. This ensures the parts are handled properly, the project is completed according to a verifiable process, data is properly stored, and the experienced lab can not only complete the results but communicate the results. As computed tomography data is complex, large in file size, and new for some people; effective communication is key to ensure all parties are properly informed of the results for effective decisions to be made.
ASSEMBLY
For Assemblies, there are 3 primary areas that have had a large amount of success when adopting CT Scanning. These areas include:
Qualifying New Products
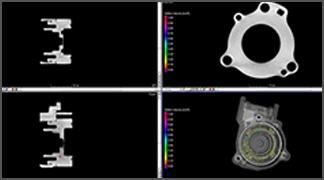
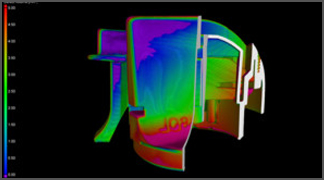
Typically traditional manufacturing and inspection techniques have proven to be highly effective in verifying production assemblies. However, when complex assemblies are manufactured the costs and time for validating products internally or in a free state environment can quickly add up. X-Ray and CT Scanning can not only can be a non-destructive testing (NDT) method to perform non-contact measurements of internal features, but it can also provide a color-coded map identifying variations between the CAD model or identify features that are not being assembled as intended. Furthermore, first article inspection (FAI) can be completed according to part print requirements allowing parts to be qualified internally while being assembled.
Failure Investigation
For Assemblies, X-Ray and CT scanning failure investigation has proven to be beneficial for identifying the root cause of a potential failure. Identification of the failure not only allows companies to correct the error happening in production, but it also helps to identify a potential financial impact resulting from the failing products being used by the end customer or consumer. When even further insight is required, Micro CT scanning with very high-resolution systems can identify slight changes in geometry which could stack up to result in the overall failure. Industrial CT Scanning can provide data for virtually all physical defect types external and internal to the assembly. These include porosities, voids, and cracks, assembly misalignments, snaps or clips not engaging, inconsistent wall thickness, physical changes in material density, and fit / function variations from the nominal CAD model.
Benefiting from Service Labs
As the technology is rapidly being adopted and standards are evolving all the time, utilizing a certified service lab ensures proper compliance to the latest standards. This ensures the project is completed according to a verifiable process and the experienced lab can not only complete the results but communicate the results. As computed tomography data is complex, large in file size, and new for some people; effective communication is key to ensure all parties are properly informed of the results for effective decisions to be made.
BIOLOGICAL
For Biological samples, there are 2 primary areas that have had a large amount of success when adopting CT Scanning. These areas include:
Validation of Devices & Instruments
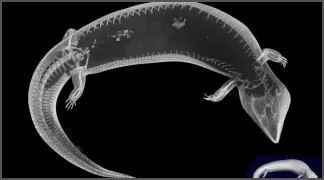
For Biological samples, X-Ray and CT scanning on the industrial side has a very specific fit for inspection. The application happens when a medical device company or instrument company is looking to verify the performance of a device on an organic sample with industrial precision. Typically, medical CAT scan systems can only achieve a low-resolution scan with varying degrees of accuracy. The computed tomography systems used for industry have a much higher scan resolution than their medical counterparts. For this reason alone, the inspection of biological samples has proven highly effective when using macro or micro-CT scanning systems. Instances that have proven highly effective include the inspection of biological samples with stents, heart valves, screws, eye implants, and other implantable surgical devices. For the instrument industry, the need happens when a precision medical instrument is being developed to accurately record measurements and distances. To effectively calibrate such a sample with non-destructive testing (NDT), precision measurements obtained from the industrial CT scan allows for calibration of the instrument without destroying or altering the sample. Once the scan is complete, correlation of the measurements is then performed for benchmarking purposes.
Benefiting from Service Labs
As the technology is rapidly being adopted and standards are evolving all the time, utilizing a certified service lab ensures proper compliance to the latest standards. This ensures the project is completed according to a verifiable process and the experienced lab can not only complete the results but communicate the results. As computed tomography data is complex, large in file size, and new for some people; effective communication is key to ensure all parties are properly informed of the results for effective decisions to be made.
CASTINGS
For Castings, there are 3 primary areas that have had a large amount of success when adopting CT Scanning. These areas include:
Failure Investigation
For castings, failure investigation using CT scanning has been the primary need for accessing this emerging technology. When a failure is identified, usually the customer is experiencing pressure by their customer to quickly identify the root cause of the failure in additional to mitigating the financial impact the failure could cause. As a non-contact nondestructive testing (NDT) method, X-Ray and CT scanning can identify internal physical geometry failures without destroying the part and preserving its original condition during the forensic investigation. With CAT scan technology, failing parts can be compared to known good parts or the 3D part data to further aid in the identification of a physical geometry defect that could be occurring. In addition to geometry features being out of tolerance material analysis for cracks, pores, voids, and inclusions can be inspected by size where a single or overconcentration of anomalies could affect the overall performance of the casting. Virtually all types of die castings, sand castings, forgings, and investment castings made from both ferrous and non-ferrous materials like aluminum, titanium, stainless steel, Inconel, copper, and brass have paired well with computed tomography.
Reducing Costs
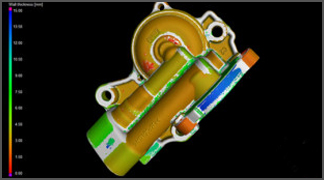
Typically traditional manufacturing and inspection techniques have proven to be highly effective in verifying production products. However, during the launch of new products (FAI – First Article Inspection) or annual qualifications of production runs (LAI – Last Article Inspection), measurement costs and time frames can really stack up. When utilizing CAT scan inspection, products can be quickly validated without destructive means to save on costly samples being manufactured and allowing additional downstream testing to be performed on the same component. Furthermore, the utilization of surface profiles and wall thickness analysis in the 3D realm allows for a detailed color map aligned by the customers preferred datum scheme for a visual insight paired with key dimensions being measured. As x-ray and radiography specifications have been beneficial when qualifying castings based upon minimum pore sizes and shrinkage, computed tomography is able to leverage existing standards for inputting the radiography parameters into CT analysis and reporting requirements for performing a comparable service in 3D.
Benefiting from Service Labs
As the technology is rapidly being adopted and standards are evolving all the time, utilizing a CT certified service lab ensures proper compliance to the latest standards. This ensures the project is completed according to a verifiable process and the experienced lab can not only complete the results but communicate the results. As computed tomography data is complex, large in file size, and new for some people; effective communication is key to ensure all parties are properly informed of the results for effective decisions to be made.
COMPOSITES
For Composites, there are 3 primary areas that have had a large amount of success when adopting CT Scanning. These areas include:
Qualifying New Products
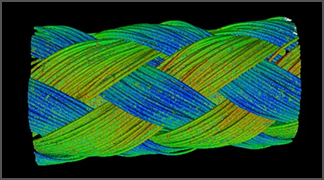
Typically traditional manufacturing and inspection techniques have proven to be highly effective in verifying production products. However, when high precision parts require qualification, the costs and time for validating measurements can quickly add up. CT Scanning not only has the ability to be a non-destructive testing (NDT) method to perform non-contact measurements of part features, but it can also provide a color-coded map identifying variations between parts or variations to the nominal model. During the launch of new products (FAI – First Article Inspection) or annual qualifications of production runs (LAI – Last Article Inspection), measurement costs and time frames can really stack up. When utilizing CAT scan inspection, products can be quickly validated without destructive means to save on costly samples being manufactured and allow for additional downstream testing to be performed on the same component. Furthermore, the utilization of surface profiles in the 3D realm allows for a detailed color map aligned by the customers preferred datum scheme to be completed and paired with key dimensional measurements. Composite parts of a wide variety of shapes and sizes have benefited from the use of CT scanning such as 3D printed parts, graphite products, springs, and high temperature components. Another key area for new product validation is the identification of pores or cracks that are forming during the manufacturing process. When CT Scanning is used the technology can positively aid manufacturing companies in developing a repeatable and low defect manufacturing process for production.
Failure Investigation
X-Ray and CT scanning in a failure investigation has proven beneficial for identifying the root cause of a potential composite part failure. Identification of the failure not only allows companies to correct the error happening in production, but it also helps to identify a potential financial impact resulting from the failing products. When even further insight is required, Micro CT scanning with very high-resolution systems can identify slight changes in geometry which could stack up to result in an overall failure. Industrial CT Scanning can provide data for virtually all physical defect types external and internal to the product. These include porosities, voids, and cracks, assembly misalignments, inconsistent wall thickness, variations in material geometry, and variations from the nominal CAD model.
Benefiting from Service Labs
As the technology is rapidly being adopted and standards are evolving all the time, utilizing a certified service lab ensures proper compliance to the latest standards. This ensures the project is completed according to a verifiable process and the experienced lab can not only complete the results but communicate the results. As computed tomography data is complex, large in file size, and new for some people; effective communication is key to ensure all parties are properly informed of the results for effective decisions to be made.
ELECTRONICS
For Electronics, there are 3 primary areas that have had a large amount of success when adopting CT Scanning. These areas include:
Qualifying New Products
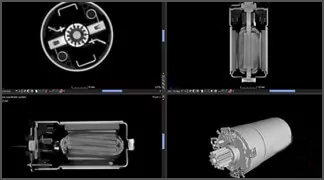
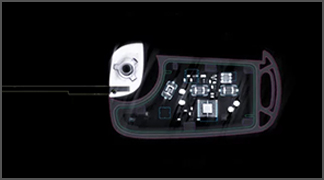
Typically traditional inspection techniques for electronics have proven to be highly effective in verifying electrical circuits. However, when exterior components effect performance, the costs and time for validating products internally or in a free state environment can quickly add up. X-Ray and CT Scanning can not only can be a non-destructive testing (NDT) method to perform non-contact measurements of internal features, but it can also provide a color-coded map identifying variations between the CAD model or identify features that are not being manufactured as intended. Furthermore, porosity inspection can be performed for potted or over-molded electronics to verify the size and locations of pores which could be impacting the components performance. Products like batteries, connectors, actuators, and temperature probes are examples of electronic devices that have been verified using computed tomography.
Failure Investigation
For electronics, X-Ray and CT scanning failure investigation has proven to be beneficial for identifying the root cause of a potential failure. Identification of the failure not only allows companies to correct the error happening in production, but it also helps to identify a potential financial impact resulting from the failing products being used by the end customer or consumer. When even further insight is required, Micro CT scanning with very high-resolution systems can identify slight changes in geometry which could stack up to result in the overall electronic failure. Industrial CT Scanning can provide data for virtually all physical defect types external and internal to the product. These include porosities, voids, and cracks, assembly misalignments, broken leads, debris, solder balls, engagement, or lack of engagement.
Benefiting from Service Labs
As the technology is rapidly being adopted and standards are evolving all the time, utilizing a certified service lab ensures proper compliance to the latest standards. This ensures the project is completed according to a verifiable process and the experienced lab can not only complete the results but communicate the results. As computed tomography data is complex, large in file size, and new for some people; effective communication is key to ensure all parties are properly informed of the results for effective decisions to be made.
MACHINED
For Machined parts, there are 3 primary areas that have had a large amount of success when adopting CT Scanning. These areas include:
Qualifying New Products
Typically traditional inspection techniques for machined products have proven to be highly effective in verifying exterior features. However, when internal or difficult to measure features effect performance, the costs and time for validating products internally or in a free state environment can quickly add up. X-Ray and CAT Scanning can not only can be a non-destructive testing (NDT) method to perform non-contact measurements of internal features, but it can also provide a color-coded map identifying variations between the CAD model or identify features that are not being manufactured as intended. Difficult to measure dimensional callouts such as surface profile, sphericity, and concentricity can be completed with computed tomography analysis tools as the entire workspace is in 3D. Furthermore, porosity inspection in welded areas can verify the quality and performance of the final product. Depending on the cost of the end product, sometimes computed tomography is even feasible to use as a tool for qualifying every part. Products like brackets, gears, gaskets, pulleys, heat transfer devices, housing, precision instruments, aerospace & space components, and medical devices have been verified successfully to the manufacturers requirements using computed tomography.
Failure Investigation
For machined parts, X-Ray and CT scanning failure investigation has proven to be beneficial for identifying the root cause of a potential failure. Identification of the failure not only allows companies to correct the error happening in production, but it also helps to identify a potential financial impact resulting from the failing products being used by the end customer or consumer. When even further insight is required, Micro CT scanning with very high-resolution systems can identify slight changes in geometry which could stack up to result in the overall product failure. Industrial CT Scanning can provide data for virtually all physical defect types external and internal to the product. These include porosities, voids, and cracks, assembly misalignments, runout, tolerance deviations, and wall thickness variations.
Benefiting from Service Labs
As the technology is rapidly being adopted and standards are evolving all the time, utilizing a certified service lab ensures proper compliance to the latest standards. This ensures the project is completed according to a verifiable process and the experienced lab can not only complete the results but communicate the results. As computed tomography data is complex, large in file size, and new for some people; effective communication is key to ensure all parties are properly informed of the results for effective decisions to be made.
MINERALS
For minerals, there are 2 primary areas that have had a large amount of success when adopting CT Scanning. These areas include:
Internal Composition Structure
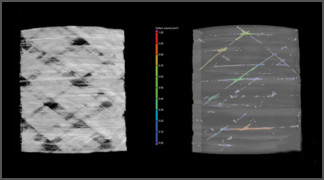
For minerals, the primary benefit for accessing the technology is to preserve the condition of the original samples while gaining insight in regards to the internal composition. Industrial computed tomography is a useful tool for internal inspection of natural substances in raw or core sample form like clays, refractory substances, metal ores, silicates, and multi material substances. Our industrial CT scanning services can identify the internal composition of minerals by material density and characterize internal features, cracks, and porosities without disturbing or altering samples. The technology can provide critical sample data for a variety of applications including ore evaluations for mining and petroleum industries and inspecting soil samples, concrete, asphalt, or bricks for civil engineering purposes. CT technology offers advantages over conventional methods like optical inspection for dimensional and geometric analyses of cut gemstones like diamonds and sapphires. As an x-ray-based technology which utilizes changes in density, CT scanning can perform inspection and measurement of clear or reflective materials as it does not require the use of touch probes or exterior forces to perform the inspection.
Benefiting from Service Labs
As the non-destructive testing (NDT) technology is rapidly being adopted and standards are evolving all the time, utilizing a certified service lab ensures proper compliance to the latest standards. This ensures the project is completed according to a verifiable process and the experienced lab can not only complete the results but communicate the results. As computed tomography data is complex, large in file size, and new for some people; effective communication is key to ensure all parties are properly informed of the results for effective decisions to be made.
MOLDED
For Molded parts, there are 3 primary areas that have had a large amount of success when adopting CT Scanning. These areas include:
Qualifying New Products
Typically traditional manufacturing and inspection techniques have proven to be highly effective in verifying elastomer, thermoplastic, and metal molded products. However, when highly detailed parts, difficult to measure parts, or multi cavity tools require qualification the costs and time for validating measurements can quickly add up. CT Scanning not only can be a non-destructive testing (NDT) method to perform non-contact measurements of part features, but it can also provide a color-coded map identifying variations between cavities or variations to the nominal model. The utilization of surface profiles in the 3D realm allows for a detailed color map aligned by the customers preferred datum scheme to be completed and paired with key dimensional measurements. During the launch of new products (FAI – First Article Inspection) can be completed with computed tomography according to the part print requirements all without physical contact putting exterior forces on the part itself. Molded parts of a wide variety of materials and sizes have benefited from the use of CT scanning such as blow molding, plastic injection molding, metal injection molding, reaction injection molding, multi-color molding, and thermoforming. Polymer welds can also be verified for porosity in instances like hot plate welding, fused welding, and sonic welding.
Failure Investigation
X-Ray and CT scanning in a failure investigation has proven beneficial for identifying the root cause of a potential molded part failure. Identification of the failure not only allows companies to correct the error happening in production, but it also helps to identify a potential financial impact resulting from the failing products being used by the end customer. When even further insight is required, Micro CT scanning with very high-resolution systems can identify slight changes in geometry which could stack up to result in an overall failure. Industrial CT Scanning can provide data for virtually all physical defect types external and internal to the product. These include porosities, voids, and cracks, assembly misalignments, snap function, inconsistent wall thickness, shrinkage, warp, and variations from the nominal CAD model.
Benefiting from Service Labs
As the technology is rapidly being adopted and standards are evolving all the time, utilizing a certified service lab ensures proper compliance to the latest standards. This ensures the project is completed according to a verifiable process and the experienced lab can not only complete the results but communicate the results. As computed tomography data is complex, large in file size, and new for some people; effective communication is key to ensure all parties are properly informed of the results for effective decisions to be made.
SINTERED
For Sintered parts, there are 3 primary areas that have had a large amount of success when adopting CT Scanning. These areas include:
Qualifying New Products
Typically traditional inspection techniques for sintered products have proven to be highly effective in verifying the weld quality. However, when internal or difficult to measure features effect performance, the costs and time for validating products internally or in a free state environment without destructive testing can quickly add up. X-Ray and CAT Scanning can not only can be a non-destructive testing (NDT) method to perform non-contact measurements of internal features, but it can also provide a color-coded map identifying variations between the CAD model, variation to a known “good” part, or identify features that are not being manufactured as intended. Difficult to measure dimensional callouts such as surface profile, sphericity, and concentricity can be completed with computed tomography analysis tools as the entire workspace is in 3D. Furthermore, porosity inspection in welded areas can verify the quality and performance of the final product. Depending on the cost of the product, sometimes computed tomography is even feasible to use as a tool for qualifying every part. Products like pipes, complex assemblies, brazed joints, solder sub sections, and fusion of metallic powders have been verified successfully to the manufacturer’s requirements using computed tomography.
Failure Investigation
For sintered parts, X-Ray and CT scanning failure investigation has proven to be beneficial for identifying the root cause of a potential failure. Identification of the failure not only allows companies to correct the error happening in production, but it also helps to identify a potential financial impact resulting from the failing products being used by the end customer or consumer. When even further insight is required, Micro CT scanning with very high-resolution systems can identify slight changes in 3D geometry which could stack up to result in the overall product failure. Industrial CT Scanning can provide data for virtually all physical defect types internal to the product. These include porosities, voids, and cracks, assembly misalignments, runout, tolerance deviations, and wall thickness variations.
Benefiting from Service Labs
As the technology is rapidly being adopted and standards are evolving all the time, utilizing a certified service lab ensures proper compliance to the latest standards. This ensures the project is completed according to a verifiable process and the experienced lab can not only complete the results but communicate the results. As computed tomography data is complex, large in file size, and new for some people; effective communication is key to ensure all parties are properly informed of the results for effective decisions to be made.